 Hydra Vision Learn
Tool · Configure & Learn
Asset Profiler: know the asset first.
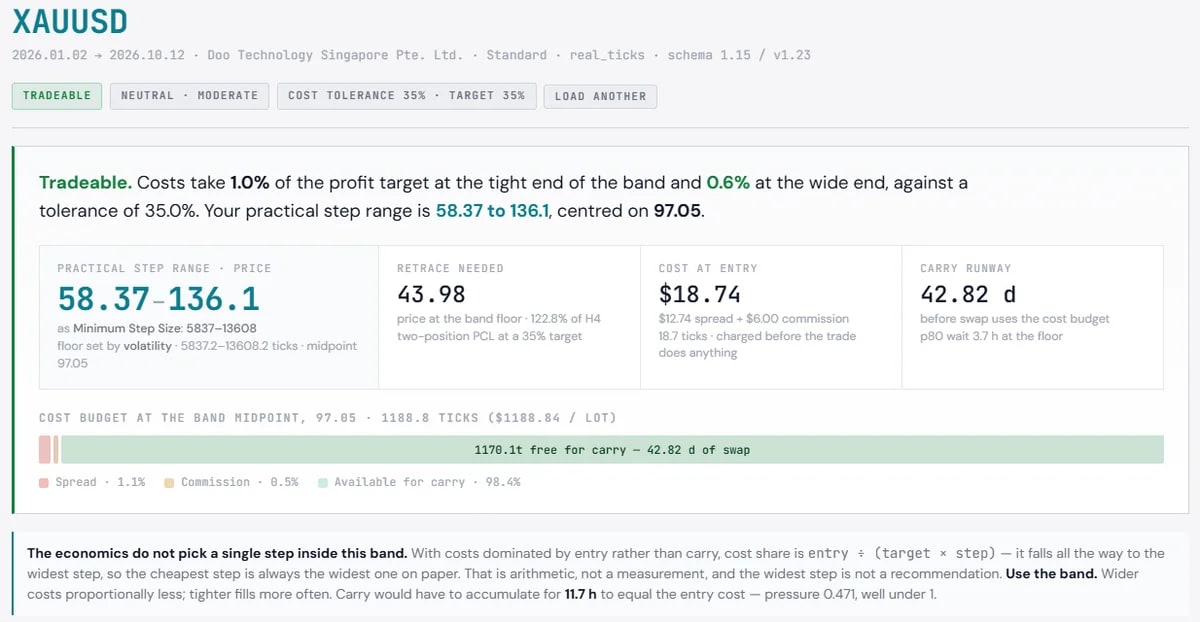
Asset Profiler measures a symbol at your broker before you configure anything: spread, swap, costs and how the price moves. Its main answer is a range of step sizes the asset can support.
The problem it solves
Every Hydra Vision strategy rests on a minimum step: the smallest gap allowed between two positions in a grid. Traditionally that number is found by running many backtests per asset. Asset Profiler measures it from the asset's own behaviour and your account's trading terms in one run.
What you see and do
Asset Profiler is a separate EA that comes with Hydra Vision. You run it in the MetaTrader 5 Strategy Tester, in a terminal logged in to a live account at your broker, because demo symbols can be set up differently. It writes a file that you upload to the platform. The report shows:
- A verdict on whether the asset's movement and costs can support a grid at all.
- The practical step range: a floor and a ceiling, also given in the unit the Minimum Step Size setting uses.
- The evidence: the cost of opening a pair of positions, how far the price must come back for PCL to close them and how long that usually takes, the cost of holding overnight, and whether the time of day makes a difference.
It is deliberately narrow. It models a fixed grid and the simplest PCL close, says nothing about volume and does not predict profit. A profile describes one asset, on one account, over one period.
Which plan includes it
Both the Free Trial and the Subscription. Compare the plans.
See it on a demo account. The trial is free for 14 days, with no credit card.
Start 14-day trial