 Hydra Vision Learn
Tool · Live & Publish
Live Analytics: live, measured like a backtest.
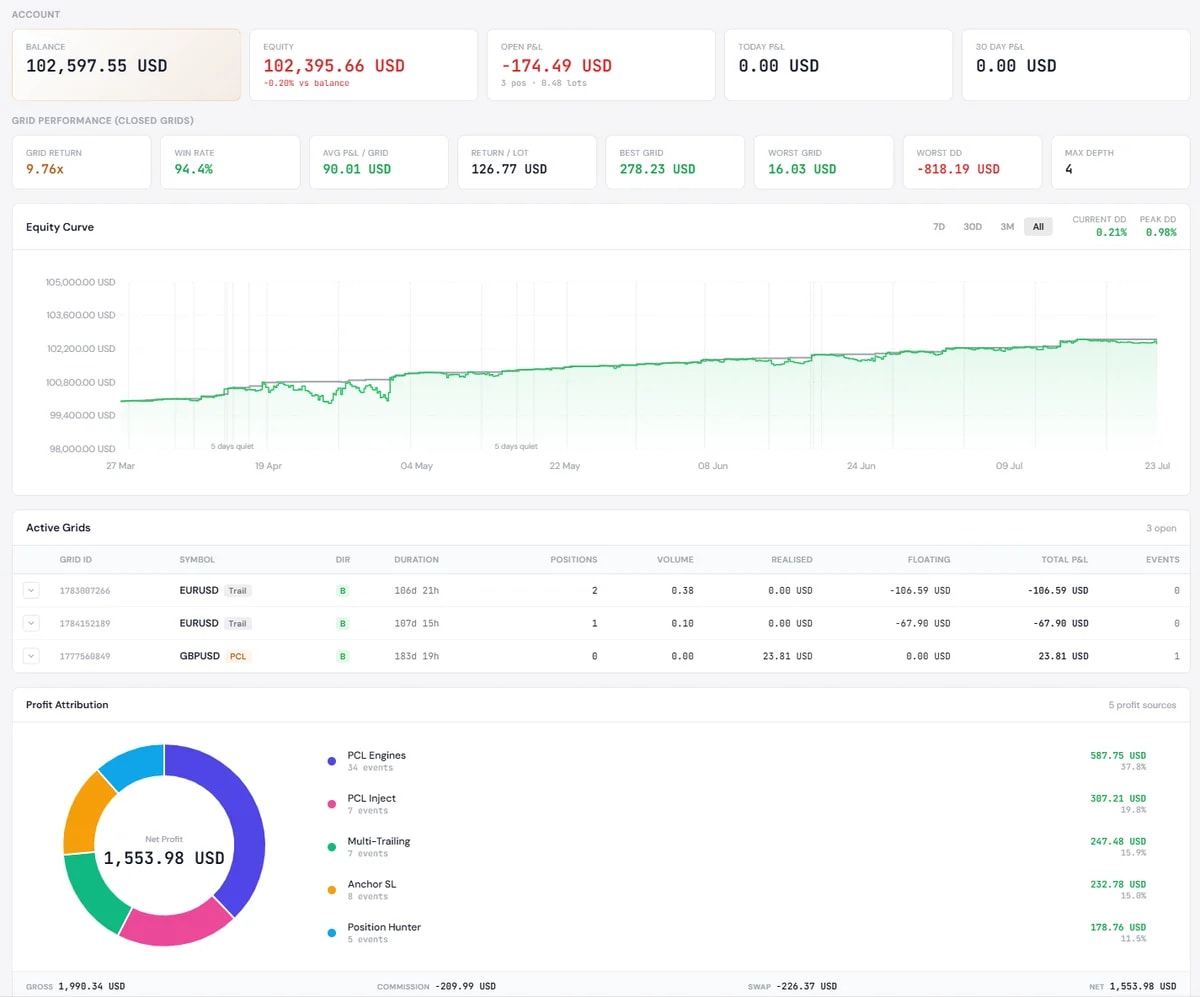
Live Analytics measures a live account running Hydra Vision the way Backtest Analysis measures a backtest: by its grids, their closes and the drawdown along the way.
The problem it solves
General account trackers see deals: what opened and closed, and at what price. They cannot see that several positions belonged to one grid, which engine closed them, or how deep the grid went. That makes it hard to tell whether a live account is behaving the way its backtests did. Live Analytics is designed to sit alongside an independent record such as Myfxbook or FXBlue, not to replace it.
What you see and do
Data arrives on its own: Hydra Agent, running beside MetaTrader, sends the account, positions, deals and the grid events GridSense records. There are four pages:
- Overview: balance, equity, open positions, active grids, recently completed grids and which engines the results came from.
- Analytics: how grids close, how long they run, how each symbol behaves, and how results vary by hour and day.
- Risk: account drawdown over time, risk by symbol, and grid depth against drawdown.
- History: completed grids and deals.
Add a backtest report for the account and a Backtest vs Live panel puts the backtest next to live trading on the same symbol and dates, measure by measure, including each engine's share.
Live Analytics works on live accounts only. Hydra Agent sends nothing for demo or contest accounts.
Which plan includes it
The Subscription. It is not part of the Free Trial. Compare the plans.
See it on a demo account. The trial is free for 14 days, with no credit card.
Start 14-day trial