 Hydra Vision Learn
Tool · Test & Optimise
Portfolio: several runs, one account.
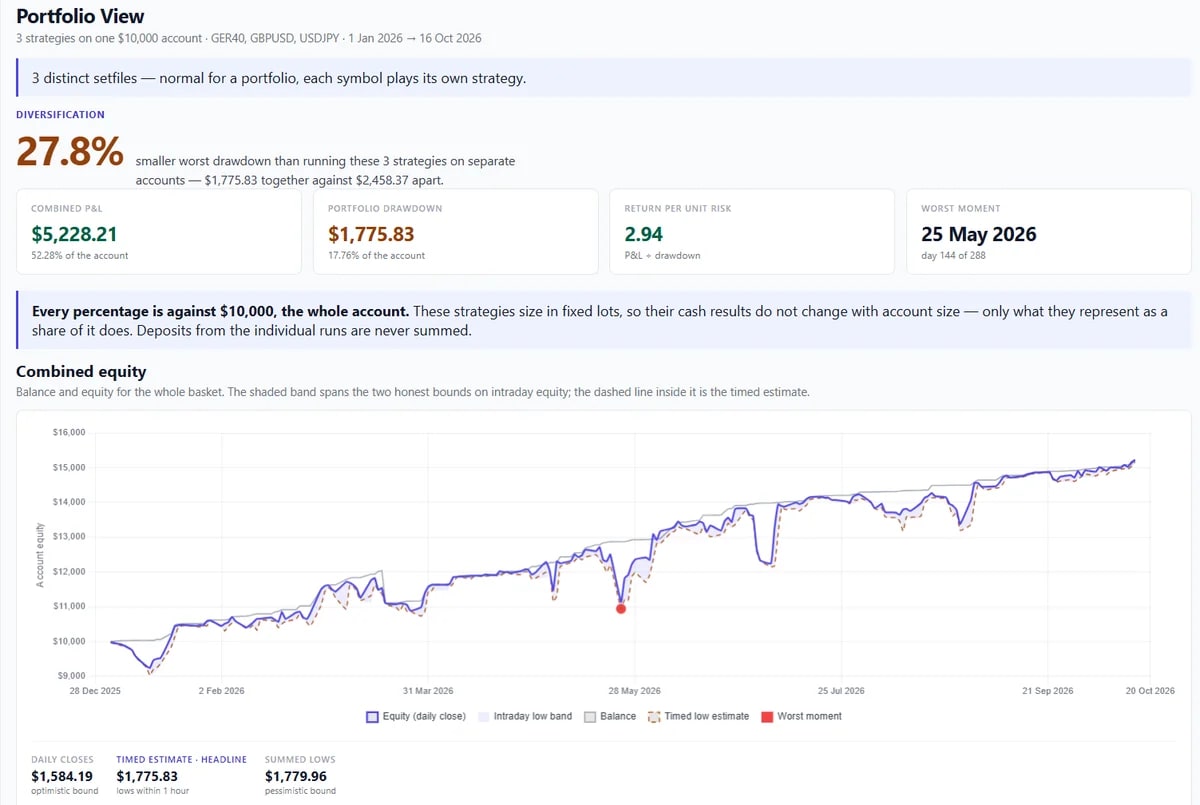
Portfolio combines backtests of different symbols into one simulated account, to show what running them together would have looked like.
The problem it solves
Each backtest runs one symbol on its own. A real account runs several at once, sharing one balance, and their drawdowns can happen at the same time or at different times. Looking at each backtest separately cannot show whether the symbols in a basket offset each other or piled onto each other when the market turned.
What you see and do
Select two to eight backtests in Backtest Analysis, one per symbol, in the same account currency and covering an overlapping period. The view clips them to the dates they share.
- Account size. You set the size of the shared account. Because Hydra Vision sizes positions in fixed lots, deposits are not added together; every percentage on the page is measured against the account size you choose.
- Diversification. How much smaller the combined worst drawdown was than the sum of each run's own worst drawdown.
- Where risk sits. Which symbols carried the drawdown, and periods when several symbols had deep grids at the same time.
- Notices when runs used different brokers or tick modelling, or were clipped.
Portfolio reports where risk sits in a basket. It does not give tuning advice, and its answers move with your settings.
Which plan includes it
Both the Free Trial and the Subscription. Compare the plans.
See it on a demo account. The trial is free for 14 days, with no credit card.
Start 14-day trial